Create a Performance Test with BlazeMeter And JMeter
Sunday, June 26, 2022
Learn to create powerful performance tests using BlazeMeter and JMeter. Elevate your testing game and optimize software performance.
#blazemeter #development-process #devops #jmeter #optimization #performance-testing #software-testing
This article is published at GitHub.You can raise issues, create pull requests or even fork the content...its open source.
Welcome to the ultimate guide on harnessing the combined power of BlazeMeter and JMeter for performance testing. In this section, we'll explore how integrating these two industry-leading tools can revolutionize your testing practices, enabling you to create robust and scalable performance tests with ease.
Prerequisites
The following prerequisites will be required to complete this tutorial:
- BlazeMeter browser extension. If you don't already have it, add the BlazeMeter extension to your browser.
- A BlazeMeter account. If you don't have a BlazeMeter account, create one for free before you begin.
- JMeter. If you don't have JMeter installed, download JMeter.
Getting Started with BlazeMeter
Let's kickstart your journey into performance testing excellence by diving into BlazeMeter. In this section, I will guide you through the process of getting started with BlazeMeter, and configuring your first performance test. Get ready to unleash the full potential of BlazeMeter and take your testing efforts to new heights.
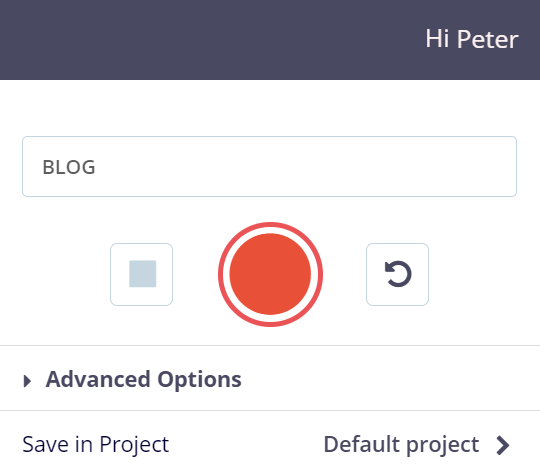
Select the
 Icon in your browser.
In the Test name box, enter a name for the test. Select the Record button, to start recording.
Select the Add Step button, to add steps for each action. When finished, select the Stop button.
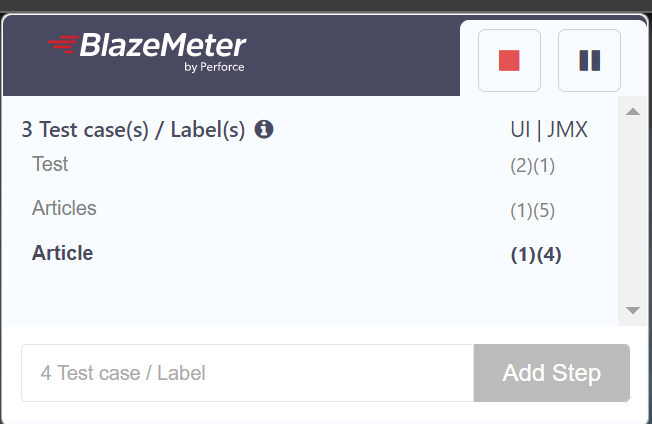
[!NOTE] When the script is saving the BlazeMeter icon will blink.
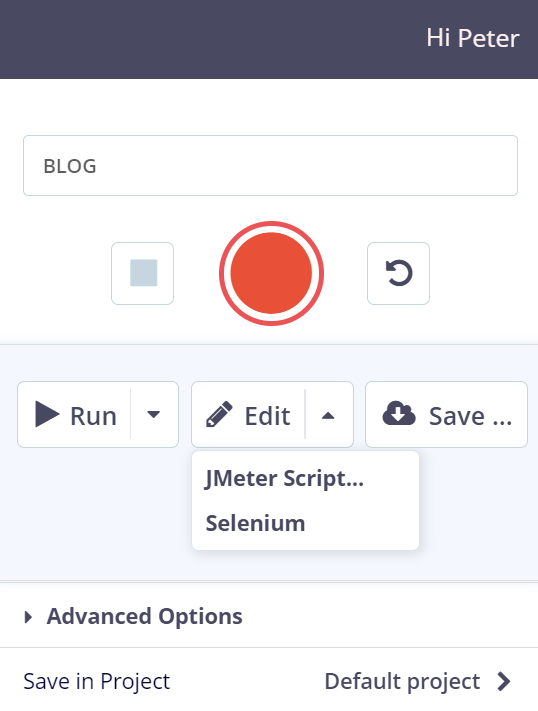
Select Edit, and then JMeter Script... (If not logged in to BlazeMeter, you will need to be for the next steps).
Select JMeter & Selenium combined (YAML), and then select Save.
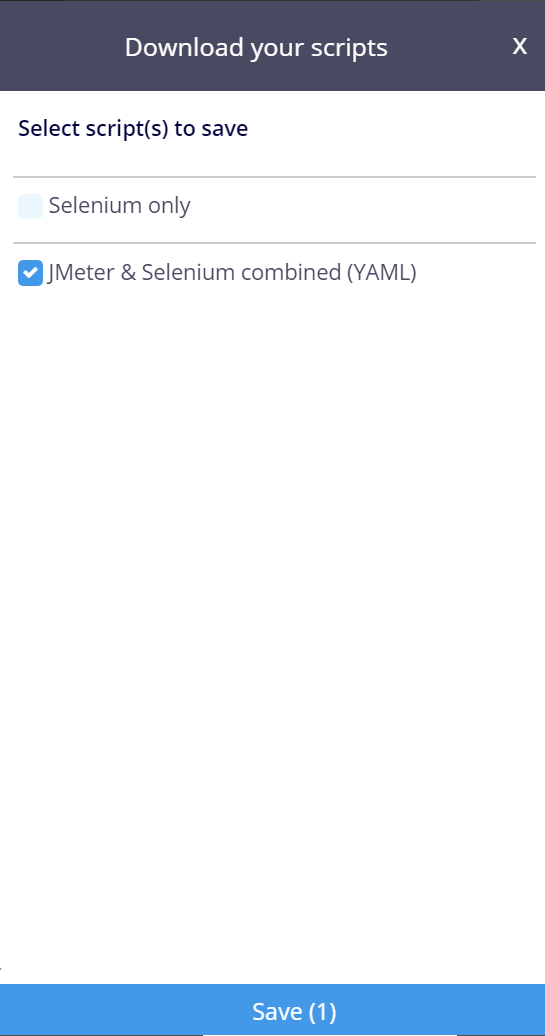
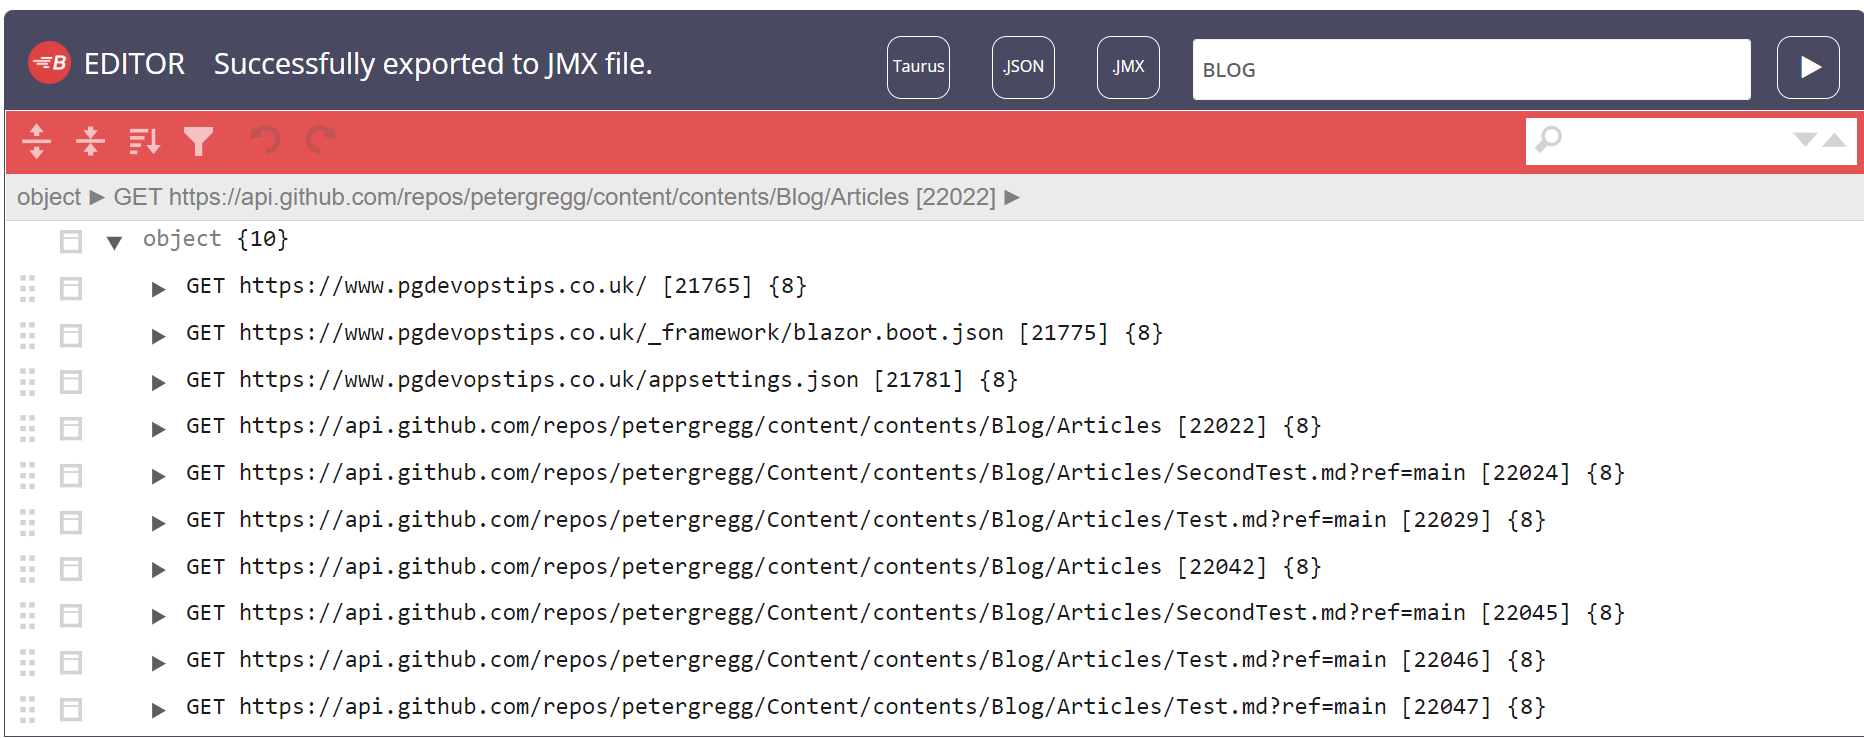
Select the .JMX button to export the JMeter script.
Integrating BlazeMeter with JMeter
Now that you're familiar with BlazeMeter, it's time to explore the seamless integration with JMeter. In this section, I will show you how to integrate BlazeMeter with JMeter to leverage the scalability and analytics capabilities of BlazeMeter while harnessing the flexibility and customization options of JMeter. Get ready to streamline your testing workflows and maximize the efficiency of your performance testing efforts.
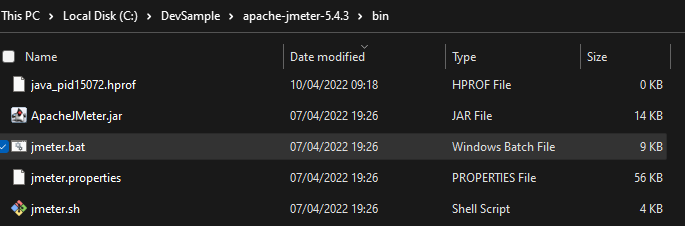
In Microsoft Windows, Open the bin folder of JMeter and run the JMeter.bat batch file.
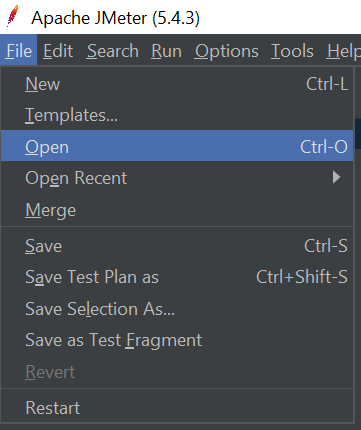
In the upper-left of the screen, select File > Open.
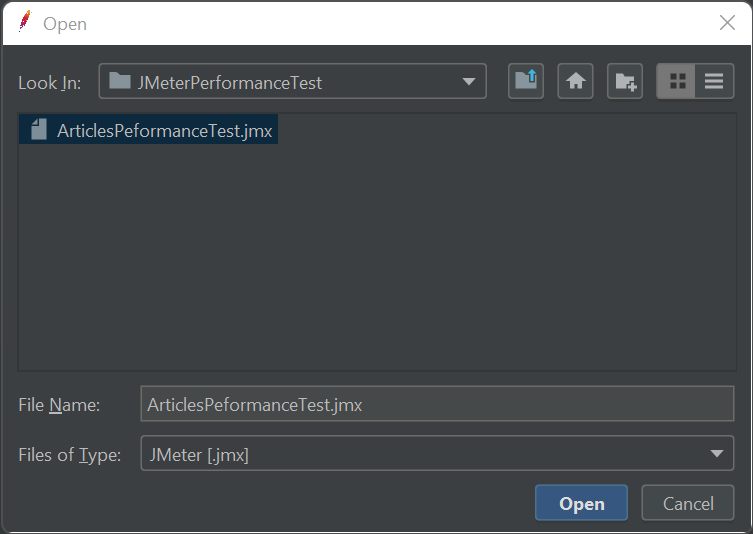
On the Open screen, select the Script, and then select Open.
Edit Thread Group properties
In the Test Plan, select the Thread Group. This is where you enter the essential information required for the performance test. Enter the following values:
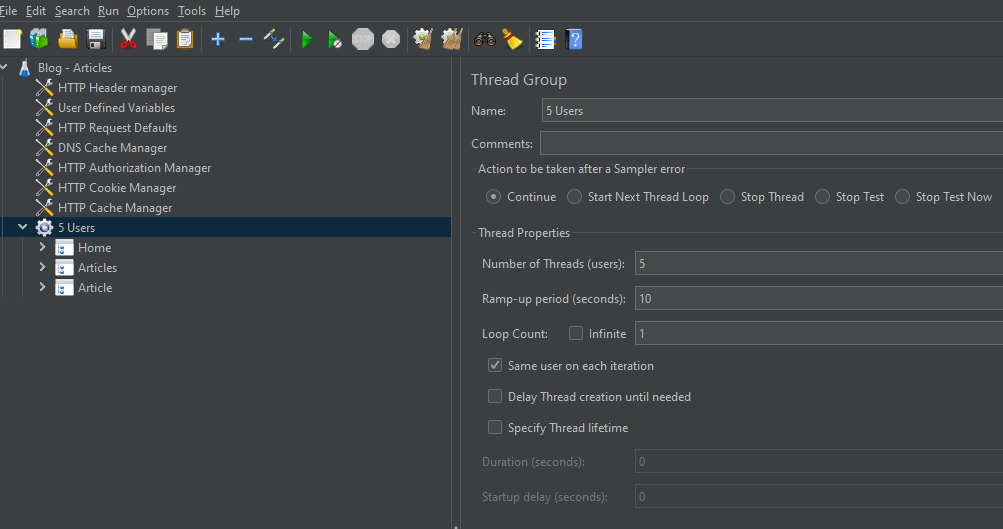
Field Value Description Name 5 Users Name of the Thread Group Comments Comment related to the Thread Group Action to be taken after a Sampler error Continue Continue with the test when an error occurs Number of Threads (users) 5 Mimics the number of user(s) or connection(s) to an application Ramp-up period (seconds) 10 Time to create all of the threads (or how frequent requests should be sent by users) Loop Count 1 Number of times the test will repeat for the thread group (or quantity of requests that should be sent) Same user on each iteration Checked If checked and the Test Plan utilises HTTP Cookie Manager - Cookies returned in the first response for subsequent requests will be used Delay Thread Creation until needed Unchecked If checked it stops JMeter allocating memory for all threads (users) when the performance test starts Specify Thread lifetime Unchecked Specify a duration and startup delay Duration (seconds) 0 Specify a duration for the whole test Startup delay (seconds) 0 Delay time before a thread is started
Add listeners
In the Test Plan, right-click the Thread Group, select Add > Listener > Summary Report.
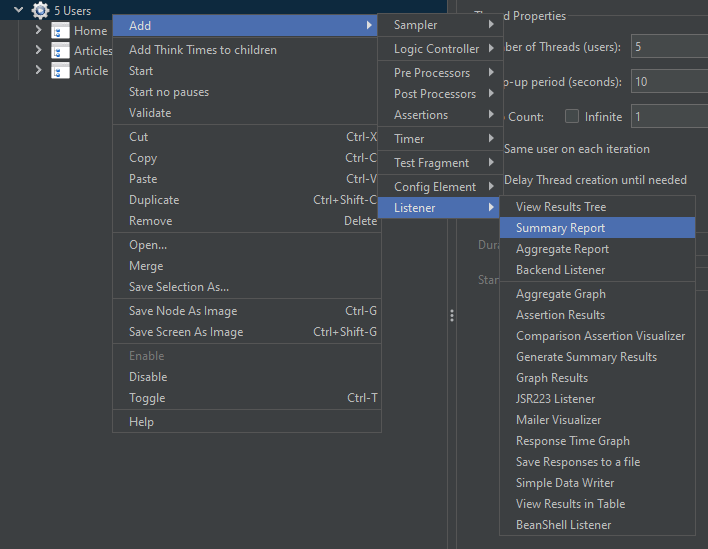
In the Test Plan follow step 4 above to add the following listeners to the Thread group and each Transaction controller.
Test Plan Area Listener Thread Group Summary Report Thread Group View Results Tree Thread Group Response Time Graph Transaction Controller Summary Report Transaction Controller View Results in Table Transaction Controller Aggregate Report Transaction Controller Graph Results 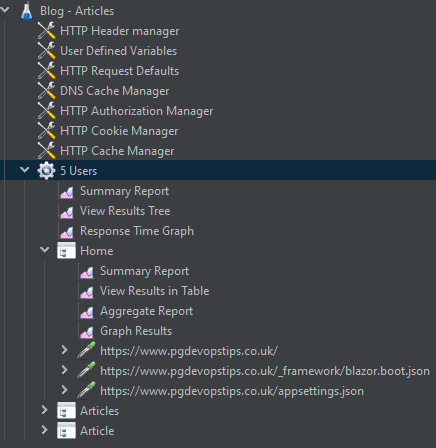
Executing and Analysing Performance Tests
With your performance tests created and your tools integrated, it's time to execute and analyze your tests. In this section, I will guide you through the process of running performance tests in BlazeMeter, monitoring test execution, and analyzing test results to identify performance bottlenecks and areas for improvement. Get ready to gain valuable insights into your application's performance and optimize its scalability and reliability.
In the JMeter screen, select the
 button.
Once running, a green indicator icon will appear in the top right of the Control Panel. JMeter will ramp up the total number of active threads to 5 in approximately 10 seconds with a delay of 2 secs between subsequent threads. The indicator box will turn to grey when the test is complete.
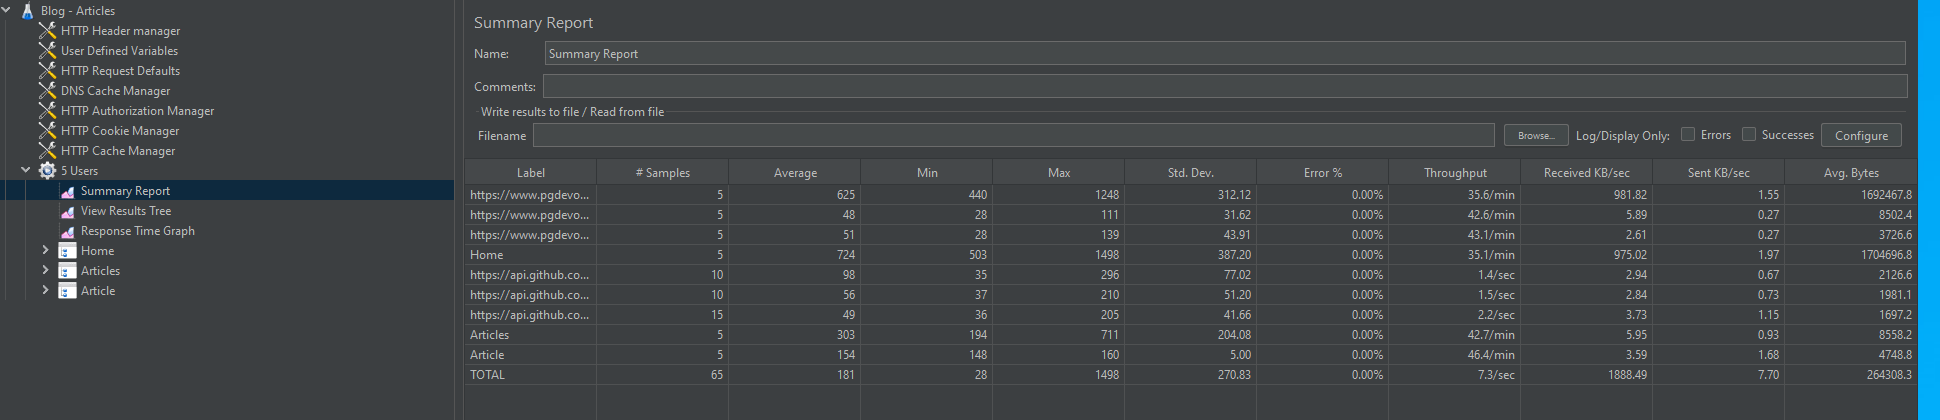
When the performance test has completed. Select the Summary Report listener in the Thread group to analyse the results.
Conclusion
In conclusion, the integration of BlazeMeter and JMeter offers a powerful solution for creating, executing, and analyzing performance tests with precision and efficiency. By following the steps outlined in this guide, you can streamline your testing processes, identify and address performance issues early in the development lifecycle, and ensure the optimal performance of your applications. Stay tuned to PGDevOpsTips for more insights and guides to optimize your DevOps practices and elevate your software delivery capabilities. Let's continue to innovate and excel in the world of performance testing together!
Got a comment?
All my articles are written and managed as Markdown files on GitHub.
Please add an issue or submit a pull request if something is not right on this article or you have a comment.
If you'd like to simply say "thanks", then please send me a so the rest of Twitter can see how awesome my work is.