Master Azure DevOps and JMeter Integration - Boost Performance Testing Efficiency
Sunday, February 11, 2024
Discover seamless JMeter integration with Azure DevOps! Elevate your performance testing capabilities and optimize software delivery pipelines
#automation #azure-devops #azure-pipelines #ci/cd #deployment-efficiency #devops-tips #integration #jmeter #load-test #performance-testing
This article is published at GitHub.You can raise issues, create pull requests or even fork the content...its open source.
In this article, we delve into the powerful synergy between Azure DevOps and JMeter. Explore how this integration revolutionizes performance testing, accelerates deployment, and ensures software excellence. Unlock the key strategies, tips, and best practices to harness the full potential of these tools for your development pipeline. Let's embark on a journey to streamline your DevOps processes and elevate your software delivery game. This article was inspired by the Run nonfunctional tests in Azure Pipelines Microsoft Learn Module.
Prerequisites
The following prerequisites will be required to complete this tutorial:
- Azure DevOps account. If you don't have an Azure DevOps account, create one for free before you begin.
- Azure DevOps project.
- A hosted Website which you own.
Setting Up Your Azure DevOps Environment
Let's kickstart our journey by configuring your Azure DevOps environment for JMeter integration. In this section, we'll walk you through the step-by-step process of setting up your Azure DevOps project, creating pipelines, and configuring agents to seamlessly incorporate JMeter into your CI/CD workflows. Get ready to optimize your DevOps processes and supercharge your performance testing capabilities.
In the root of an Azure DevOps Project, select Repos.
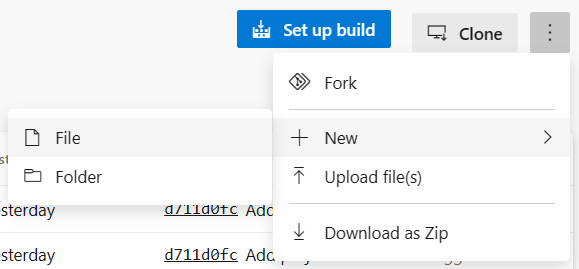
Whilst in the root of your repo, select More actions, then + New, and then Folder.
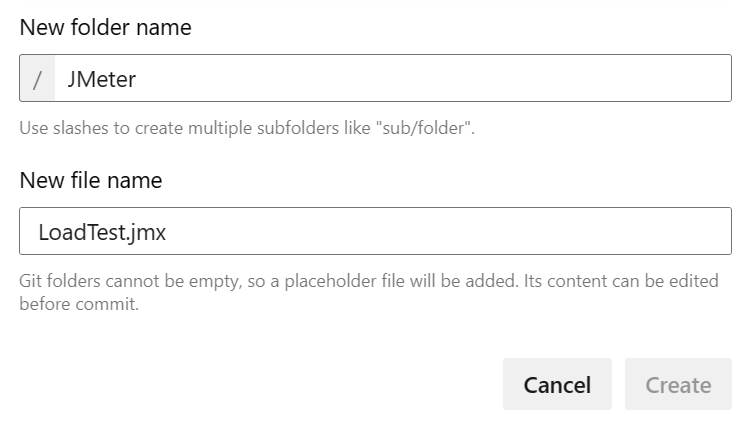
In the Modal Popup, add the folder name JMeter into the New folder name text box and the file name LoadTest.jmx into the text box.
Add the following contents to the LoadTest.jmx file.
<?xml version="1.0" encoding="UTF-8"?>
<jmeterTestPlan version="1.2" properties="5.0" jmeter="5.1.1 r1855137">
  <hashTree>
    <TestPlan guiclass="TestPlanGui" testclass="TestPlan" testname="Test Plan 1" enabled="true">
      <stringProp name="TestPlan.comments">A comment!</stringProp>
      <boolProp name="TestPlan.functional_mode">false</boolProp>
      <boolProp name="TestPlan.tearDown_on_shutdown">true</boolProp>
      <boolProp name="TestPlan.serialize_threadgroups">false</boolProp>
      <elementProp name="TestPlan.user_defined_variables" elementType="Arguments" guiclass="ArgumentsPanel" testclass="Arguments" testname="User Defined Variables" enabled="true">
        <collectionProp name="Arguments.arguments">
          <elementProp name="hostname" elementType="Argument">
            <stringProp name="Argument.name">hostname</stringProp>
            <stringProp name="Argument.value"></stringProp>
            <stringProp name="Argument.metadata">=</stringProp>
          </elementProp>
        </collectionProp>
      </elementProp>
      <stringProp name="TestPlan.user_define_classpath"></stringProp>
    </TestPlan>
    <hashTree>
      <ThreadGroup guiclass="ThreadGroupGui" testclass="ThreadGroup" testname="Thread Group" enabled="true">
        <stringProp name="ThreadGroup.on_sample_error">continue</stringProp>
        <elementProp name="ThreadGroup.main_controller" elementType="LoopController" guiclass="LoopControlPanel" testclass="LoopController" testname="Loop Controller" enabled="true">
          <boolProp name="LoopController.continue_forever">false</boolProp>
          <stringProp name="LoopController.loops">10</stringProp>
        </elementProp>
        <stringProp name="ThreadGroup.num_threads">10</stringProp>
        <stringProp name="ThreadGroup.ramp_time">10</stringProp>
        <boolProp name="ThreadGroup.scheduler">false</boolProp>
        <stringProp name="ThreadGroup.duration"></stringProp>
        <stringProp name="ThreadGroup.delay"></stringProp>
      </ThreadGroup>
      <hashTree>
        <ConfigTestElement guiclass="HttpDefaultsGui" testclass="ConfigTestElement" testname="HTTP Request Defaults" enabled="true">
          <elementProp name="HTTPsampler.Arguments" elementType="Arguments" guiclass="HTTPArgumentsPanel" testclass="Arguments" testname="User Defined Variables" enabled="true">
            <collectionProp name="Arguments.arguments"/>
          </elementProp>
          <stringProp name="HTTPSampler.domain">${__P(hostname)}</stringProp>
          <stringProp name="HTTPSampler.port"></stringProp>
          <stringProp name="HTTPSampler.protocol"></stringProp>
          <stringProp name="HTTPSampler.contentEncoding"></stringProp>
          <stringProp name="HTTPSampler.path"></stringProp>
          <stringProp name="HTTPSampler.concurrentPool">6</stringProp>
          <stringProp name="HTTPSampler.connect_timeout"></stringProp>
          <stringProp name="HTTPSampler.response_timeout"></stringProp>
        </ConfigTestElement>
        <hashTree/>
        <HTTPSamplerProxy guiclass="HttpTestSampleGui" testclass="HTTPSamplerProxy" testname="HTTP Request" enabled="true">
          <elementProp name="HTTPsampler.Arguments" elementType="Arguments" guiclass="HTTPArgumentsPanel" testclass="Arguments" testname="User Defined Variables" enabled="true">
            <collectionProp name="Arguments.arguments"/>
          </elementProp>
          <stringProp name="HTTPSampler.domain"></stringProp>
          <stringProp name="HTTPSampler.port"></stringProp>
          <stringProp name="HTTPSampler.protocol"></stringProp>
          <stringProp name="HTTPSampler.contentEncoding"></stringProp>
          <stringProp name="HTTPSampler.path"></stringProp>
          <stringProp name="HTTPSampler.method">GET</stringProp>
          <boolProp name="HTTPSampler.follow_redirects">true</boolProp>
          <boolProp name="HTTPSampler.auto_redirects">false</boolProp>
          <boolProp name="HTTPSampler.use_keepalive">true</boolProp>
          <boolProp name="HTTPSampler.DO_MULTIPART_POST">false</boolProp>
          <stringProp name="HTTPSampler.embedded_url_re"></stringProp>
          <stringProp name="HTTPSampler.connect_timeout"></stringProp>
          <stringProp name="HTTPSampler.response_timeout"></stringProp>
        </HTTPSamplerProxy>
        <hashTree/>
      </hashTree>
      <ResultCollector guiclass="SummaryReport" testclass="ResultCollector" testname="Summary Report" enabled="true">
        <boolProp name="ResultCollector.error_logging">false</boolProp>
        <objProp>
          <name>saveConfig</name>
          <value class="SampleSaveConfiguration">
            <time>true</time>
            <latency>true</latency>
            <timestamp>true</timestamp>
            <success>true</success>
            <label>true</label>
            <code>true</code>
            <message>true</message>
            <threadName>true</threadName>
            <dataType>true</dataType>
            <encoding>false</encoding>
            <assertions>true</assertions>
            <subresults>true</subresults>
            <responseData>false</responseData>
            <samplerData>false</samplerData>
            <xml>true</xml>
            <fieldNames>true</fieldNames>
            <responseHeaders>false</responseHeaders>
            <requestHeaders>false</requestHeaders>
            <responseDataOnError>false</responseDataOnError>
            <saveAssertionResultsFailureMessage>true</saveAssertionResultsFailureMessage>
            <assertionsResultsToSave>0</assertionsResultsToSave>
            <bytes>true</bytes>
            <sentBytes>true</sentBytes>
            <url>true</url>
            <threadCounts>true</threadCounts>
            <idleTime>true</idleTime>
            <connectTime>true</connectTime>
          </value>
        </objProp>
        <stringProp name="filename">./Results.xml</stringProp>
        <boolProp name="ResultCollector.success_only_logging">true</boolProp>
      </ResultCollector>
      <hashTree/>
    </hashTree>
  </hashTree>
</jmeterTestPlan>
See my Create a Performance Test with BlazeMeter and JMeter article to learn how to create a load test.
Create a Template for the JMeter report
Navigate to the JMeter folder in your repo, select More actions, then + New, and then File.
In the Modal Popup, add the file name JMeter2JUnit.xsl into the New file name text box.
Add the following contents to the JMeter2JUnit.xsl file.
<xsl:stylesheet version="1.0" xmlns:xsl="http://www.w3.org/1999/XSL/Transform" xmlns:math="http://exslt.org/math">
  <xsl:output method="xml" indent="yes" encoding="UTF-8"/>
  <xsl:template match="/testResults">
    <xsl:variable name="times" select="./httpSample/@t" />
    <xsl:variable name="failures" select="./httpSample/assertionResult/failureMessage" />
    <xsl:variable name="threshold" select="1000" />
    <testsuite>
      <xsl:attribute name="tests"><xsl:value-of select="count($times)" /></xsl:attribute>
      <xsl:attribute name="failures"><xsl:value-of select="count($failures)" /></xsl:attribute>
      <testcase>
          <xsl:variable name="avg-time" select="sum($times) div count($times)" />
          <xsl:attribute name="name">Average Response Time</xsl:attribute>
          <xsl:attribute name="time"><xsl:value-of select="format-number($avg-time div 1000,'#.##')"/></xsl:attribute>
          <xsl:if test="$avg-time > $threshold">
            <failure>Average response time of <xsl:value-of select="format-number($avg-time,'#.##')"/> exceeds <xsl:value-of select="$threshold"/> ms threshold.</failure>
          </xsl:if>
      </testcase>
      <testcase>
          <xsl:variable name="exceeds-threshold" select="count($times[. > $threshold])" />
          <xsl:attribute name="name">Max Response Time</xsl:attribute>
          <xsl:attribute name="time"><xsl:value-of select="math:max($times) div 1000"/></xsl:attribute>
          <xsl:if test="$exceeds-threshold > count($times) * 0.1">
            <failure><xsl:value-of select="format-number($exceeds-threshold div count($times) * 100,'#.##')"/>% of requests exceed <xsl:value-of select="$threshold"/> ms threshold.</failure>
          </xsl:if>
      </testcase>
    </testsuite>
  </xsl:template>
</xsl:stylesheet>
Create a Variables Group in Azure DevOps
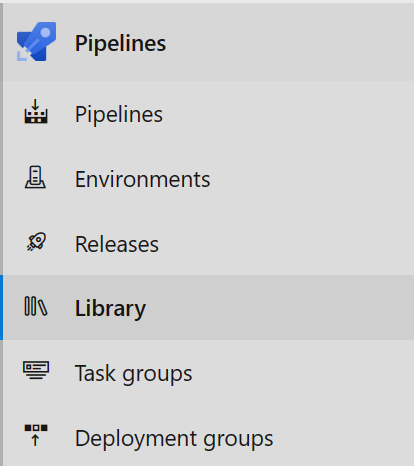
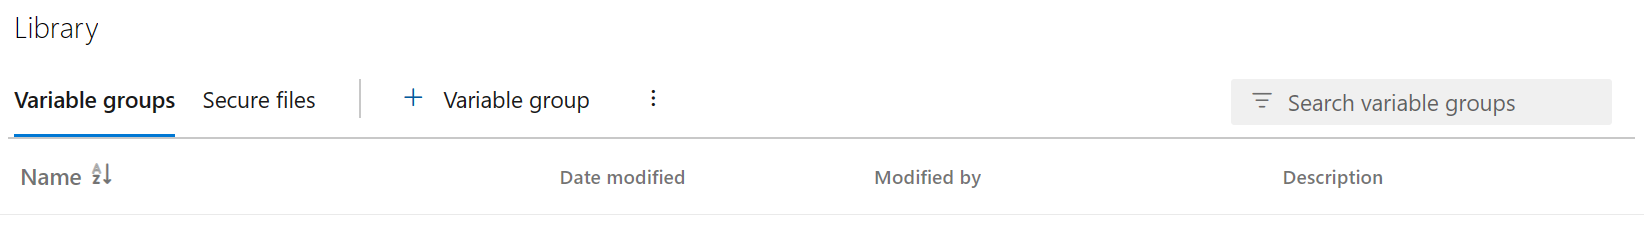
In the root of an Azure DevOps Project, under the Pipelines section, select Library.
To create a new variable group select + Variable group.
In the new Variable group, enter the following values. To add new variables in the Variables section, select + Add, replace
{YourWebsiteURL}with your website url.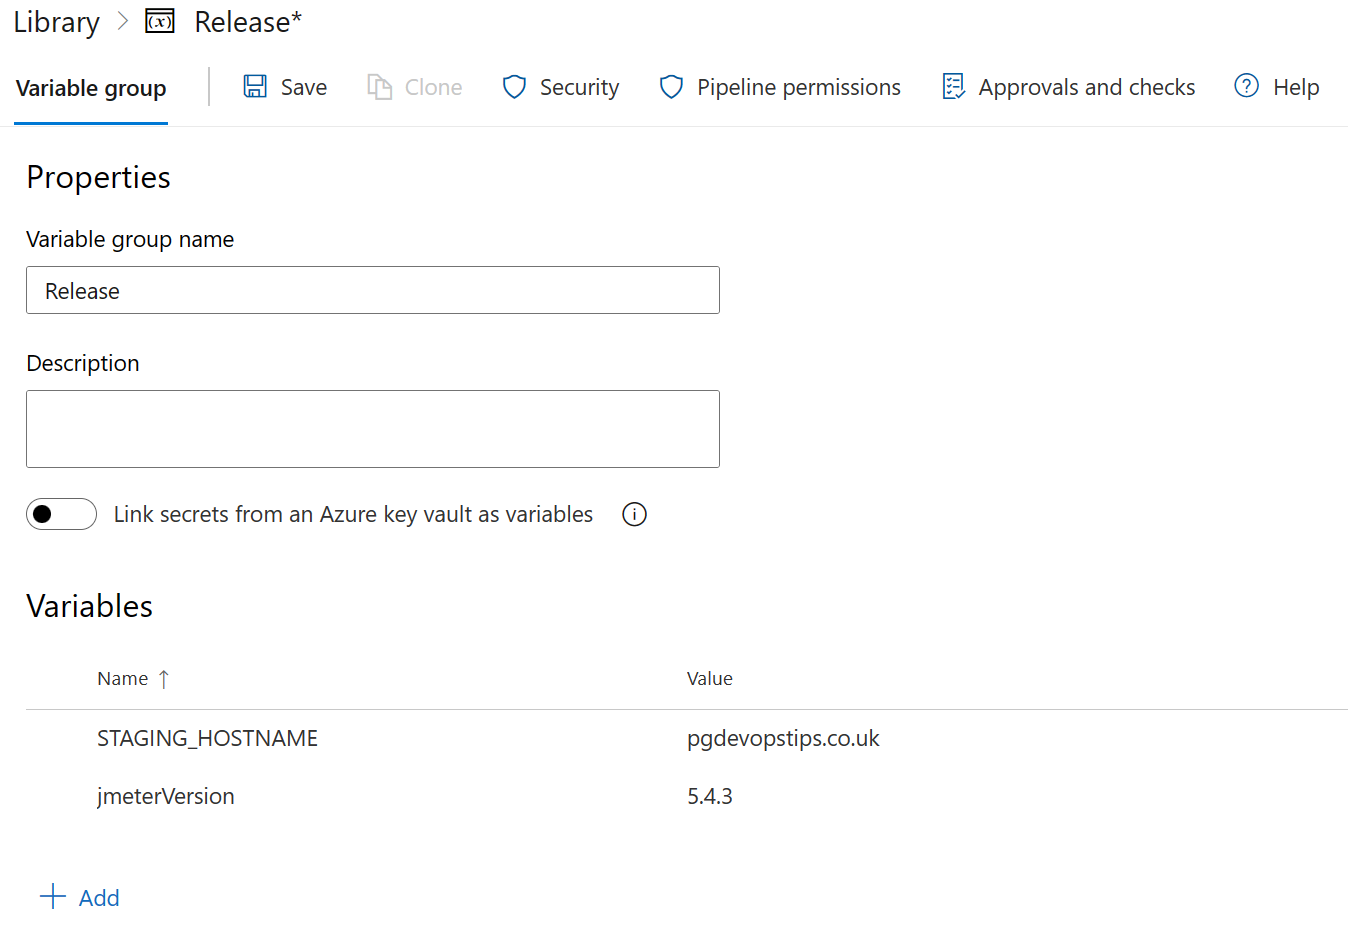
Section Field Value Description Properties Variable group name Release Name of the Variable group Variables Name STAGING_HOSTNAME Variables Value {YourWebsiteURL}Website URL to load test. You don't need to include the http:// or https:// protocol prefix in your value. JMeter provides the protocol when the tests run. Variables Name jmeterVersion Variables Value 5.4.3 Version of JMeter. To get the latest version, see Download Apache JMeter. To save the Variable group to the pipeline, select Save near the top of the page.
Integrating JMeter Tests into Azure Pipelines
Now that your Azure DevOps environment is set up, it's time to integrate your JMeter tests into your pipelines. In this section, we'll guide you through the process of adding JMeter tests as tasks in your Azure Pipelines, configuring parameters, and executing tests automatically as part of your CI/CD process. Get ready to automate your performance testing and ensure the stability and scalability of your applications with ease.
In the root of an Azure DevOps Project, select Pipelines.
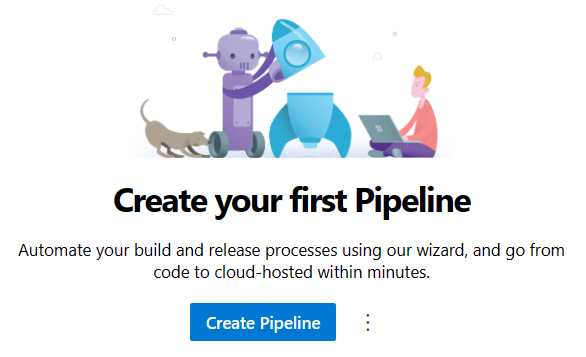
Select Create Pipeline.
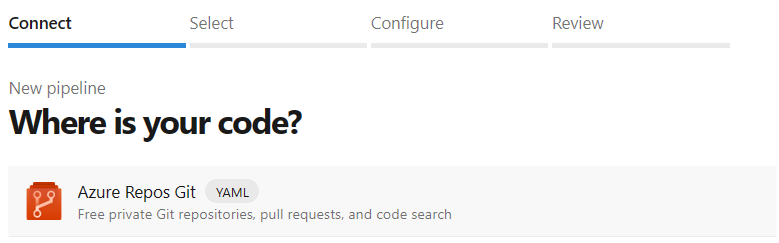
In the Connect tab, Select Azure Repos Git.
In the Select tab, select Starter pipeline YAML template.

Replace the Contents of the YAML file with the following YAML.
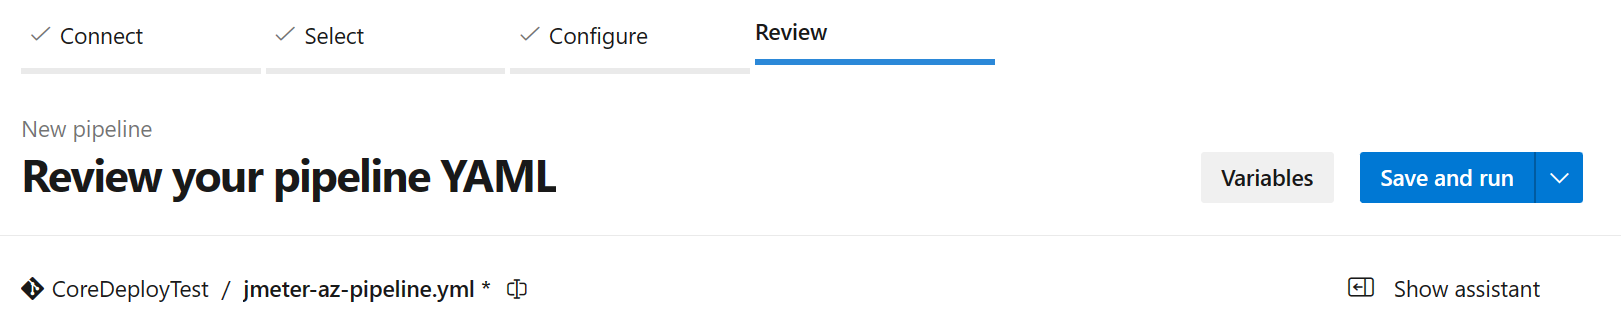
trigger:
- master

pool:
  vmImage: ubuntu-latest

variables:
    - group: Release

steps:
- script: |
      wget -c archive.apache.org/dist/jmeter/binaries/apache-jmeter-$(jmeterVersion).tgz
      tar -xzf apache-jmeter-$(jmeterVersion).tgz
  displayName: 'Install Apache JMeter'
- script: apache-jmeter-$(jmeterVersion)/bin/./jmeter -n -t JMeter/LoadTest.jmx -o Results.xml -Jhostname=$(STAGING_HOSTNAME)
  displayName: 'Run Load tests'
- script: |
      sudo apt-get update
      sudo apt-get install xsltproc
      xsltproc JMeter/JMeter2JUnit.xsl Results.xml > JUnit.xml
  displayName: 'Transform JMeter output to JUnit'
- task: PublishTestResults@2
  inputs:
    testResultsFormat: JUnit
    testResultsFiles: JUnit.xml
Rename the pipelines YAML file to jmeter-az-pipeline.yml and then select Save and run.
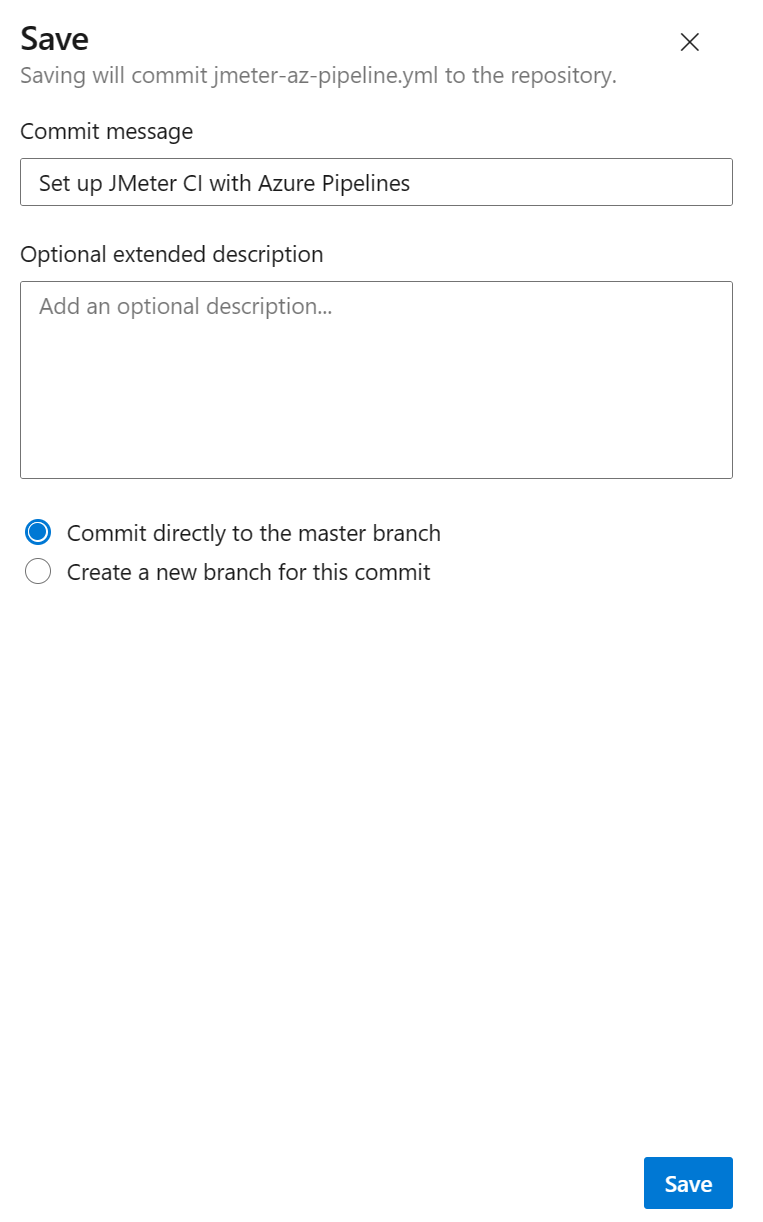
Add a commit message and then select Save.
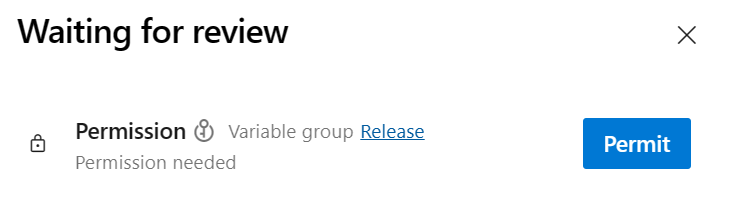
You will need to give the pipeline permission to run. In the new pipeline, select View on the permissions dialog.
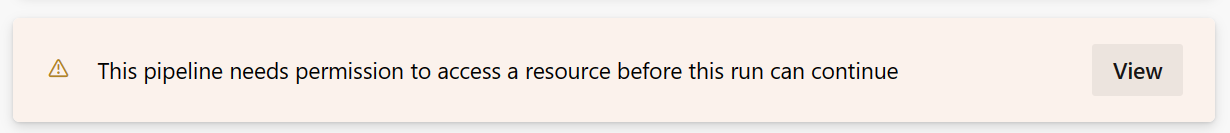
In the Waiting for review panel, select Permit.
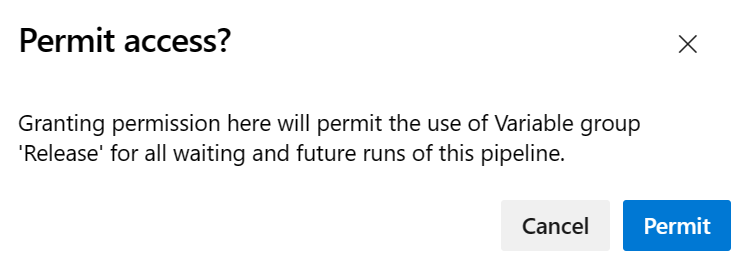
In the Permit access modal popup, select Permit.
Analysing Test Results and Performance Metrics
With your JMeter tests seamlessly integrated into Azure Pipelines, it's crucial to analyse test results and performance metrics effectively. In this section, we'll dive into strategies for retrieving and interpreting test results, generating comprehensive reports, and monitoring performance metrics using Azure DevOps tools and integrations. Get ready to gain valuable insights into your application's performance and make informed decisions to optimize its efficiency.
Navigate to Pipelines.
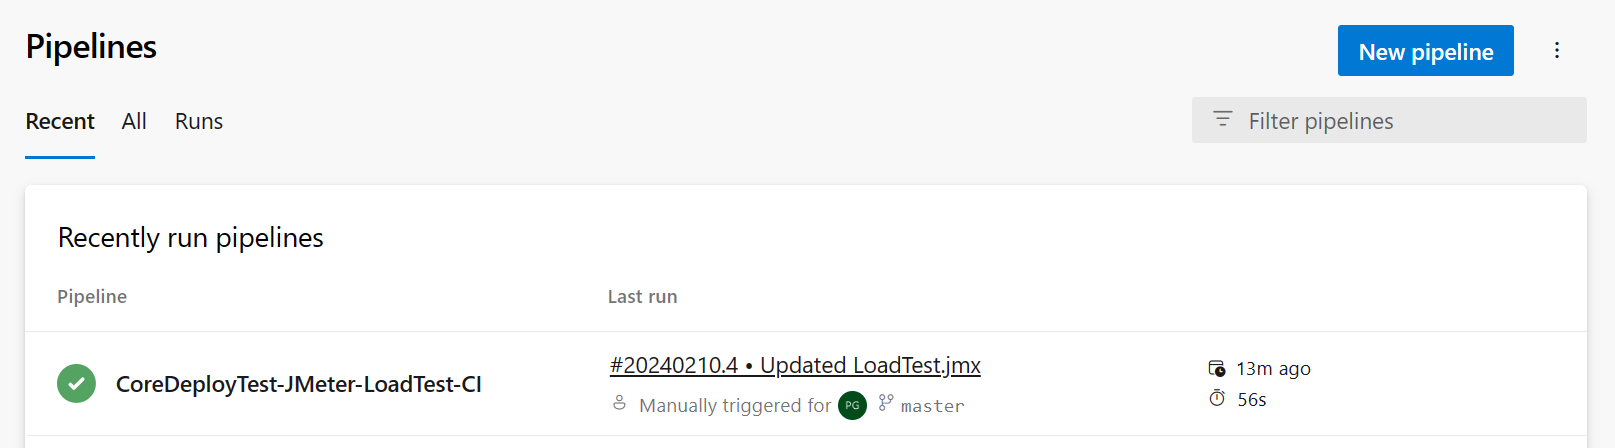
In the Runs tab, select a pipeline that has been run.
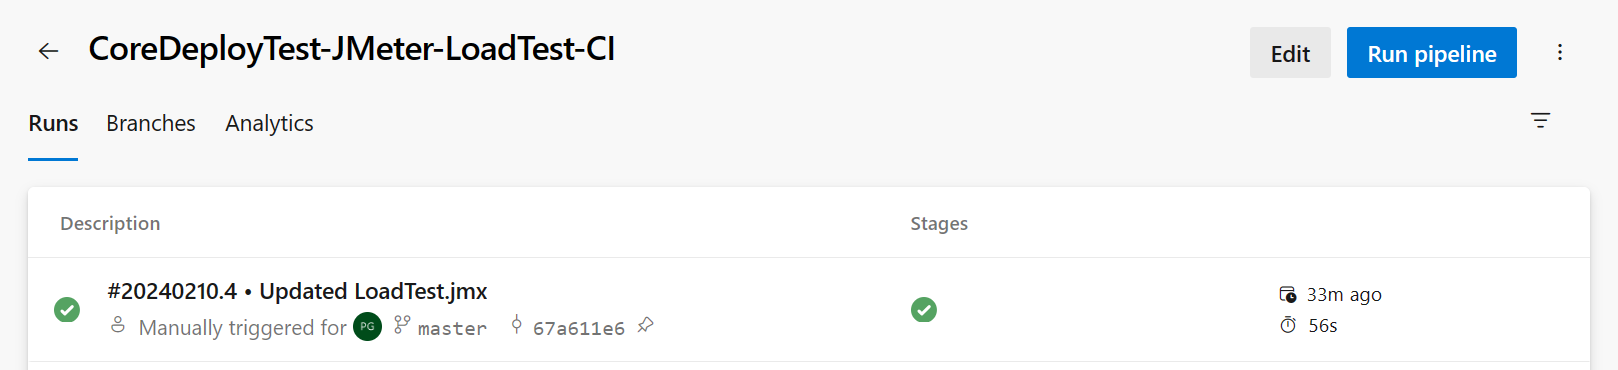
Select the Tests tab to view the JMeter test report.
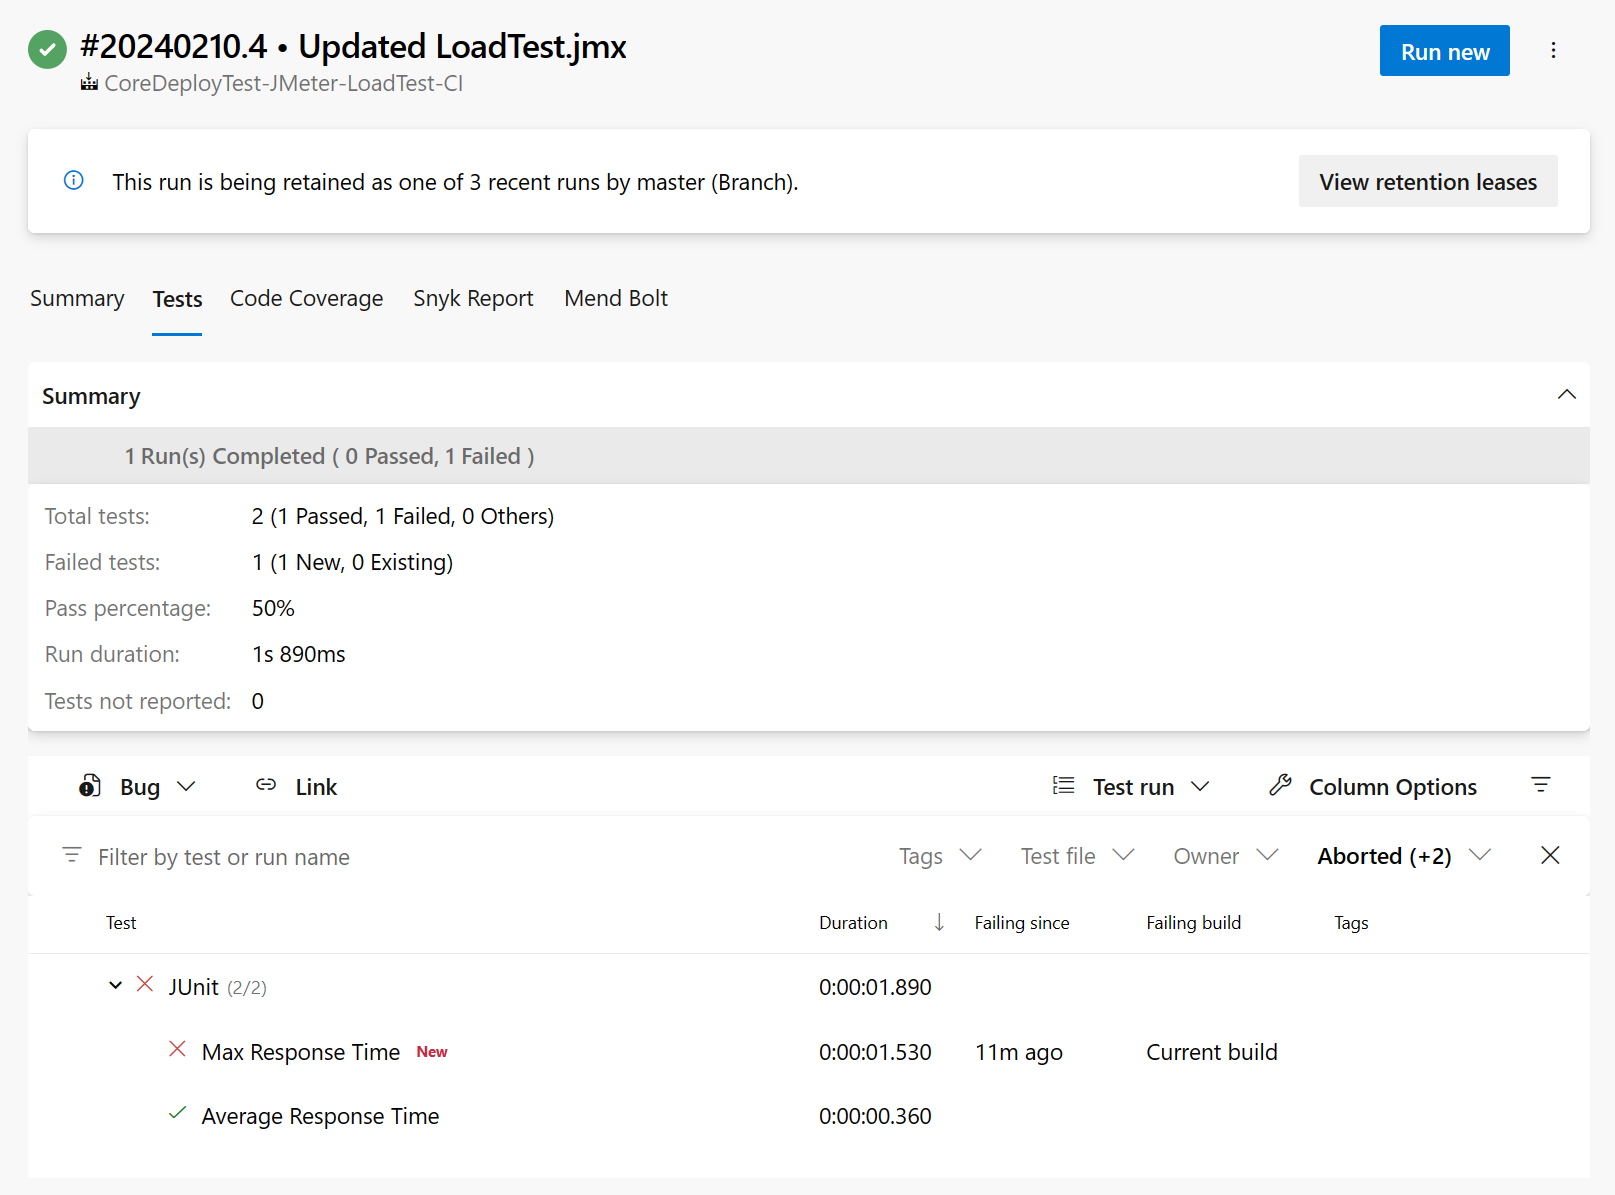
In this load test we have a test for the average request time should be less than one second which is passing, and a test for no more than 10 percent of requests should take more than one second which is failing. We can now review the code and improve the performance of the failing test.
Conclusion
In conclusion, the integration of JMeter with Azure DevOps opens up a world of possibilities for streamlining your performance testing workflows. By leveraging these powerful tools together, you can ensure the robustness and reliability of your software applications while accelerating your deployment processes. Remember to implement the strategies and tips discussed in this guide to maximize the benefits of this integration for your DevOps practices. Stay tuned to PG DevOps Tips for more insights and guides to optimize your software development lifecycle. Let's continue to innovate and elevate our DevOps journey together!
Resources
Got a comment?
All my articles are written and managed as Markdown files on GitHub.
Please add an issue or submit a pull request if something is not right on this article or you have a comment.
If you'd like to simply say "thanks", then please send me a so the rest of Twitter can see how awesome my work is.